


Boring
This post has received widespread feedback from users for being monotonous and overly repetitive.Loading..
Loading..


Claim your badge , Mine is complete.


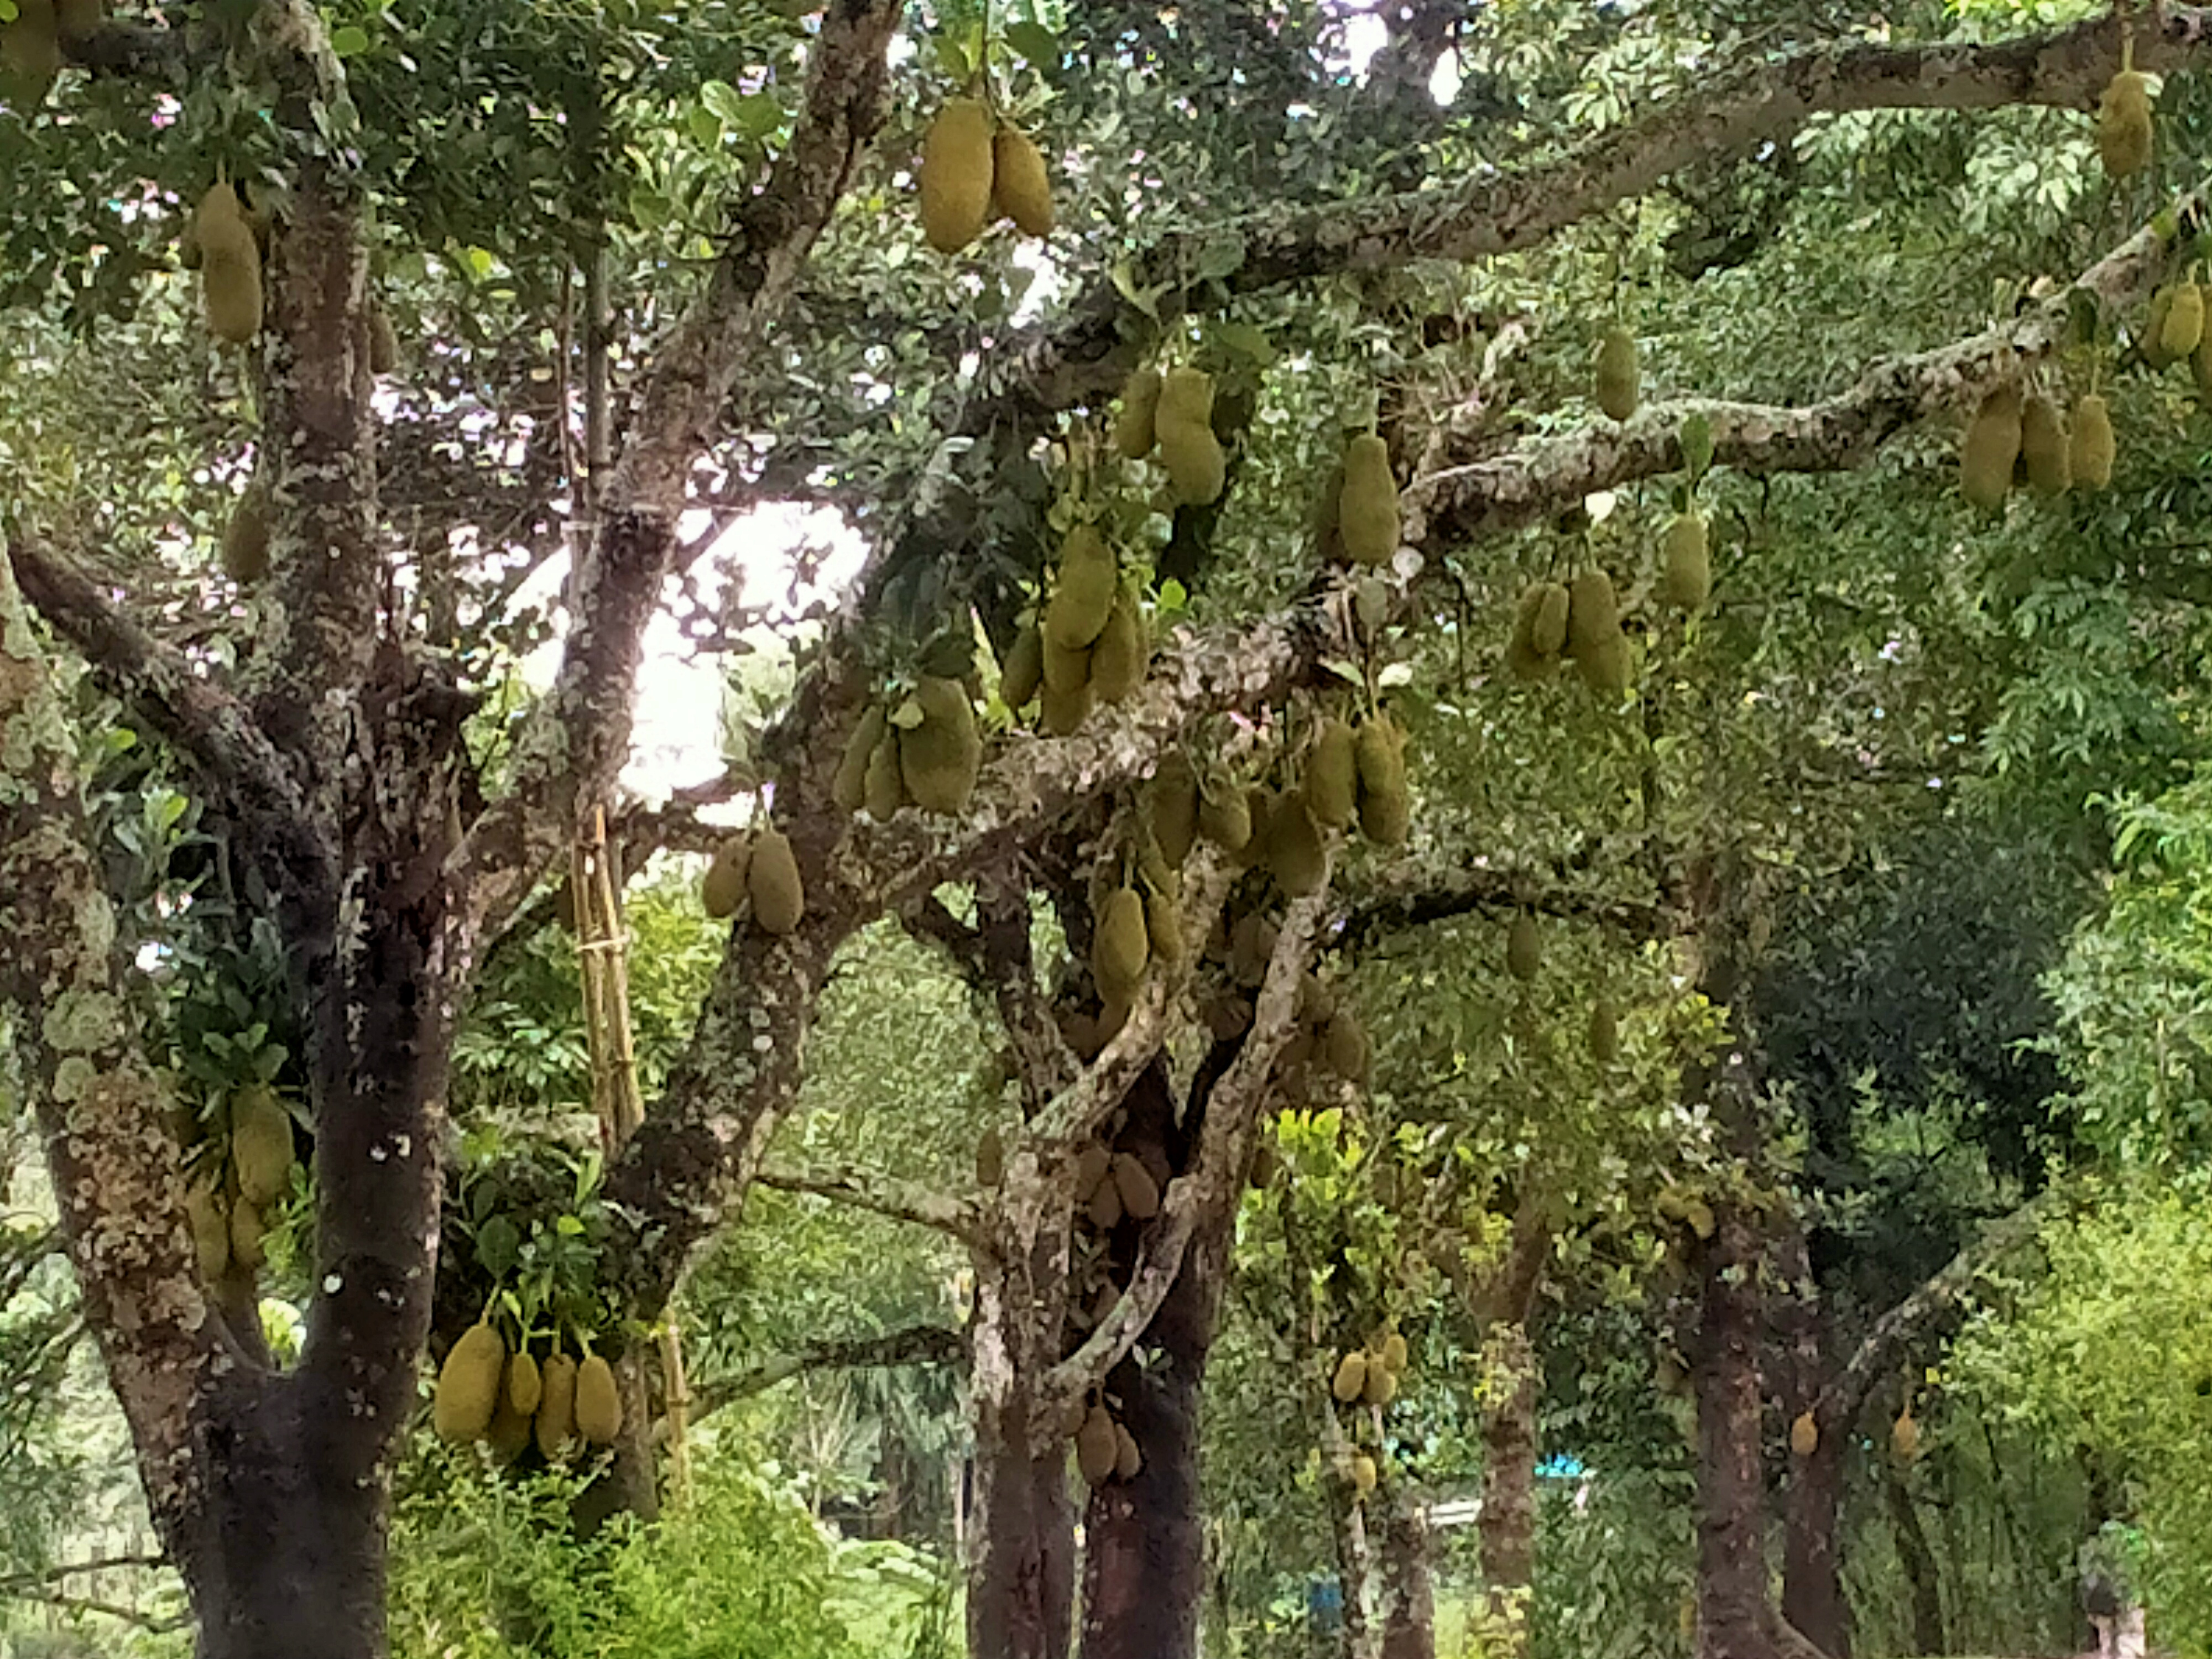

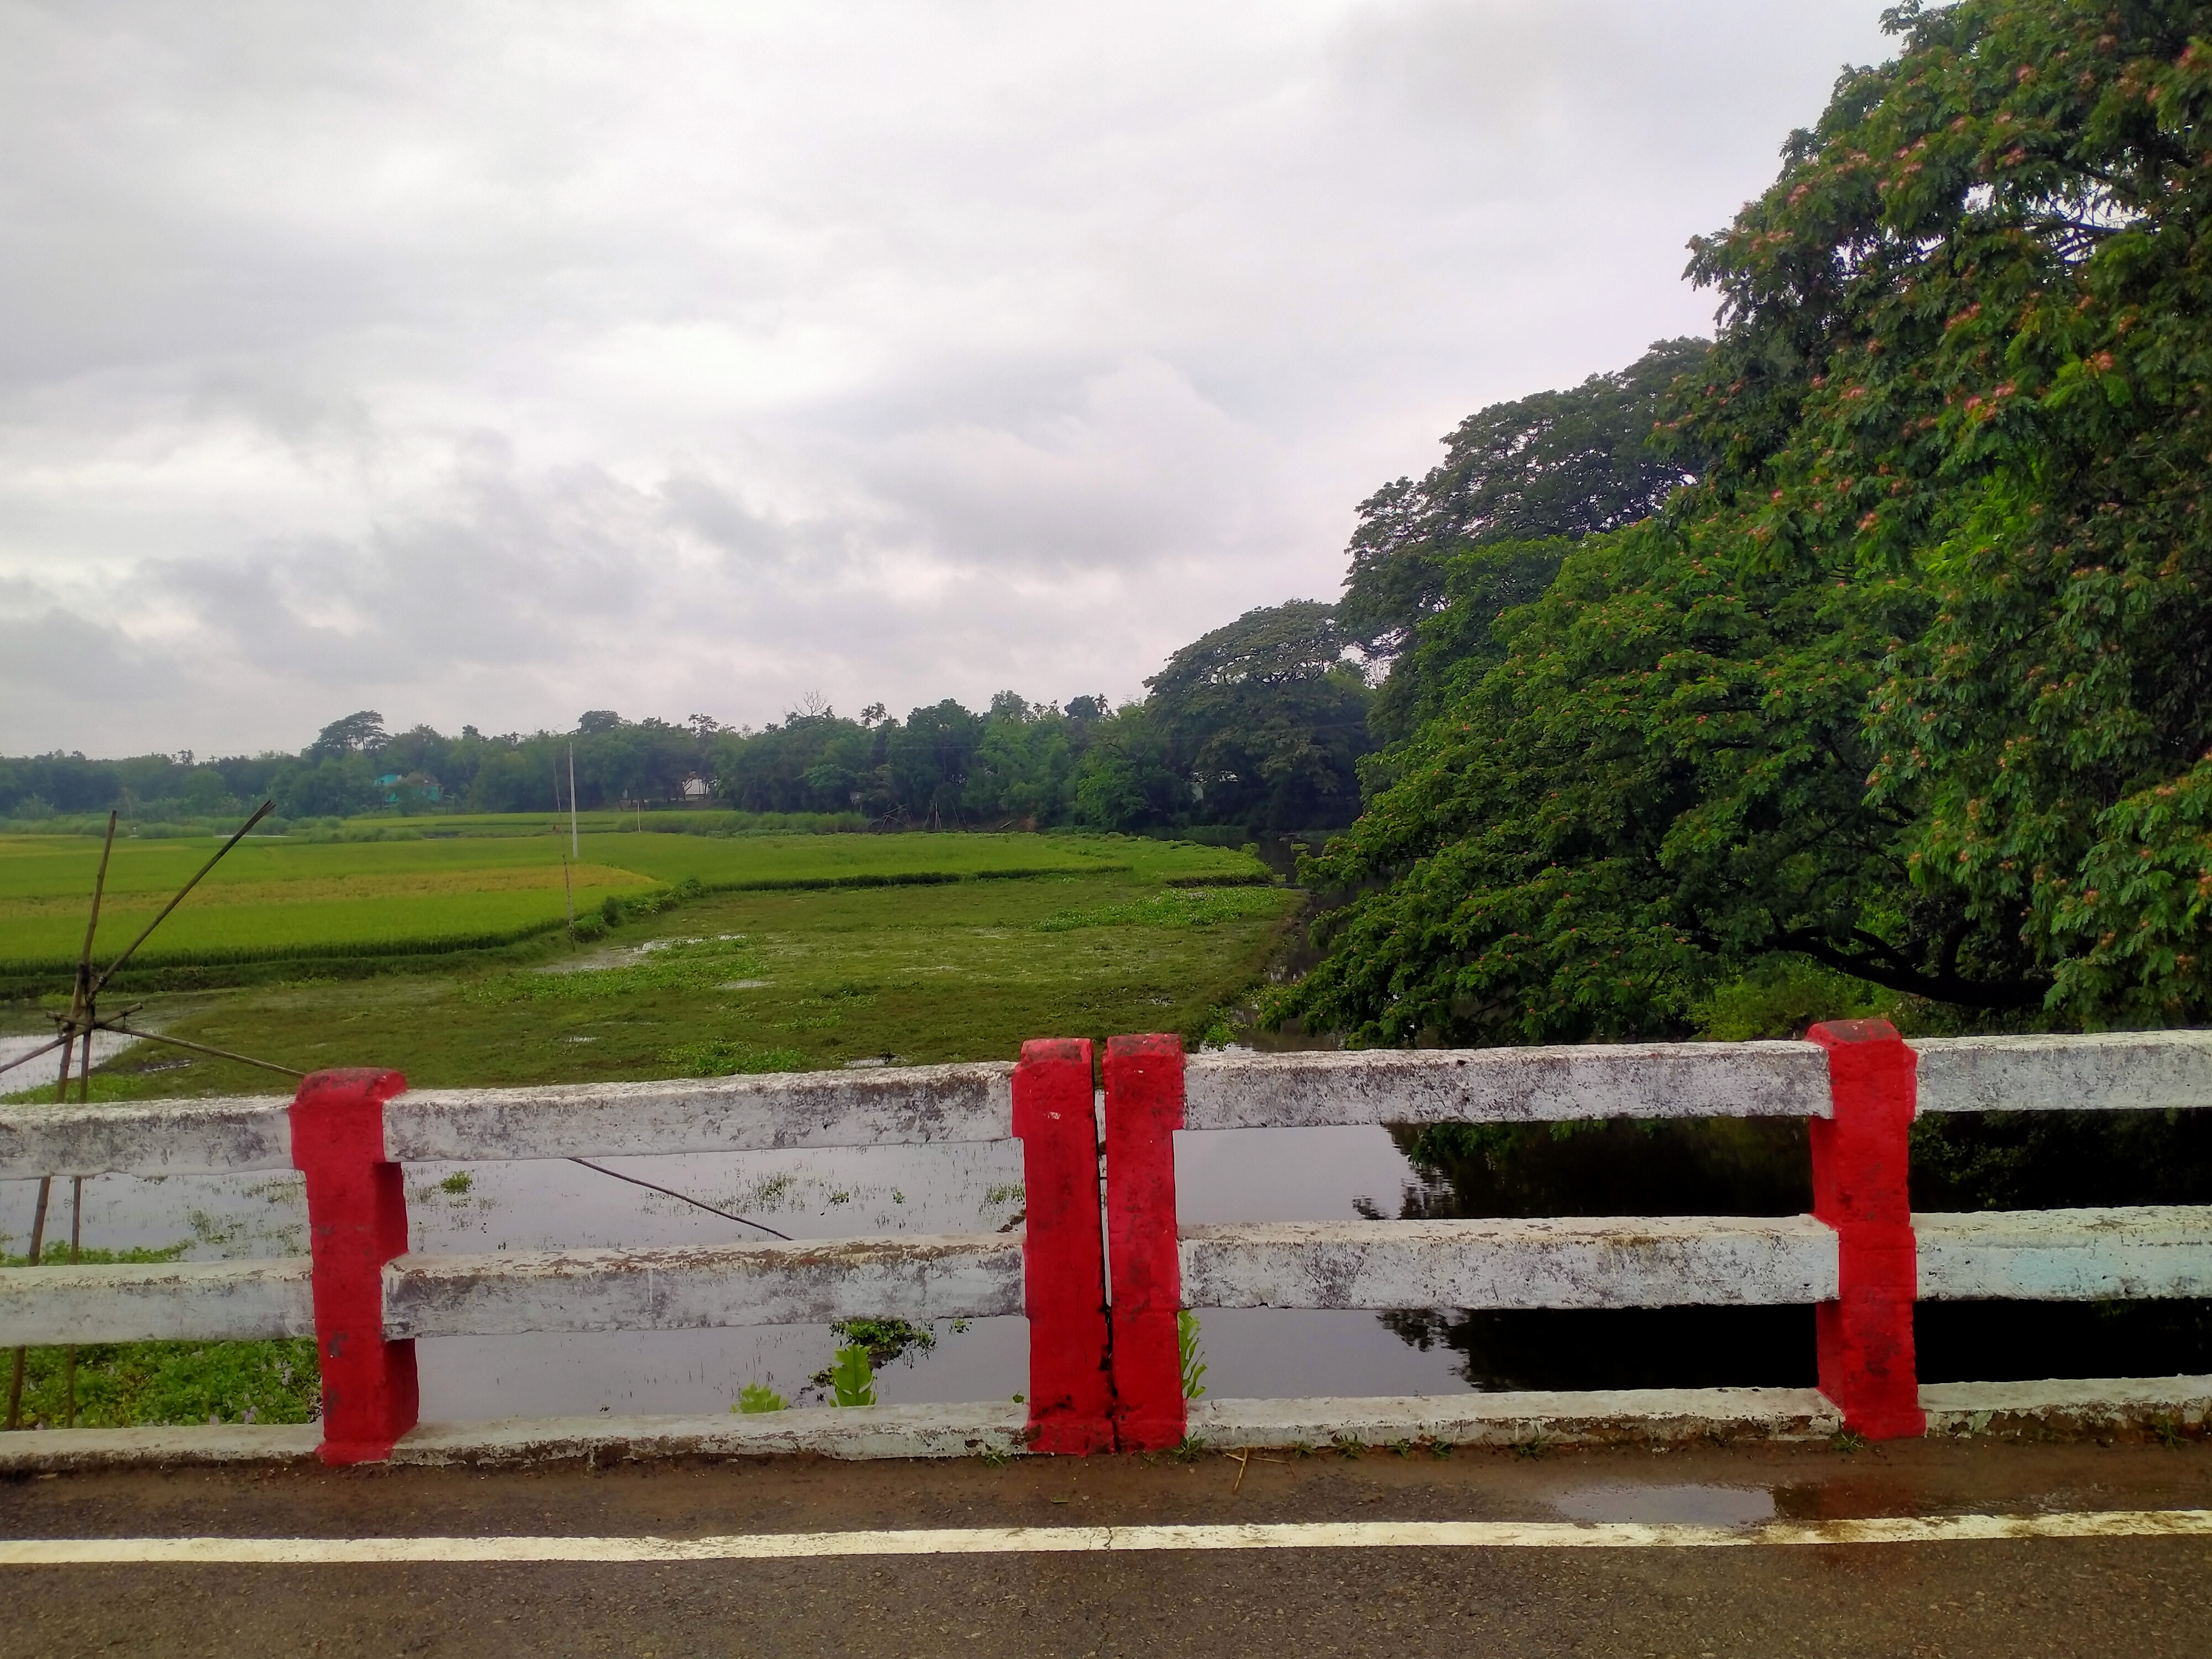
Village in Bangladesh
Sidi boureima Guire
Delete Comment
Are you sure that you want to delete this comment ?
Hamado Sawadogo
Delete Comment
Are you sure that you want to delete this comment ?
Robert Zongo
Delete Comment
Are you sure that you want to delete this comment ?